Table of Contents
The growing investors’ interest in the prospect of cryptocurrency as one of the best ways to make money online has given rise to many digital assets vying for attention and investment in the complex crypto landscape. Bitcoin, on its right, stands out as the largest and most popular cryptocurrency. While this crypto asset continues to gain traction, especially as it recently smashed the $100K psychological level, this article dives deep into the Bitcoin Dominance Chart. It is an essential tool for investors, analysts, and enthusiasts seeking to understand the relative strength and influence of Bitcoin in the broader crypto market.
Understanding The Bitcoin Dominance Chart

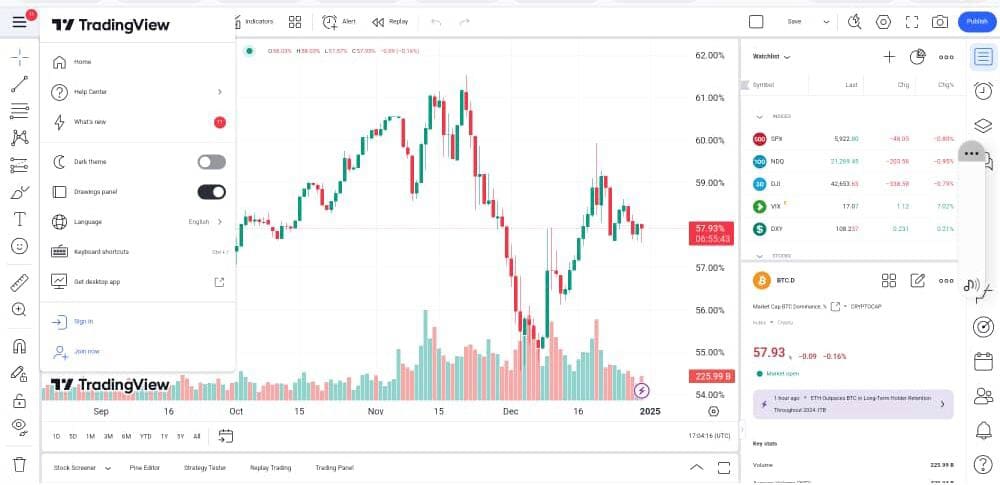
The Bitcoin Dominance Chart is a graphical representation of BTC market capitalization as a percentage of the total crypto market capitalization. In other words, the dominance chart measures Bitcoin’s relative size and influence compared to other digital assets.
The chart is often displayed as a line graph, with the x-axis representing time and the y-axis representing the percentage of BTC dominance.
How To Interpret The Bitcoin Dominance Chart
The following are the ways to effectively interpret the dominance chart:
- Trend Analysis: Identify trends in the chart, including uptrends, downtrends, or sideways movements.
- Support and Resistance Levels: Look for support and resistance levels, which can indicate potential reversals or continuous trends.
- Correlations with Other Indicators: Compare the Bitcoin Dominance Chart with other technical and fundamental indicators to gain a more extensive understanding of market trends.
- Historical Contexts: Explore the chart’s historical context, such as previous trends, reversals, and market events.
How The Bitcoin Dominance Chart Is Calculated

The dominance chart is calculated by dividing Bitcoin’s market capitalization by the total market capitalization of all cryptocurrencies. The result is then multiplied by 100 to express the value as a percentage.
For instance, if the Bitcoin market capitalization is $2 trillion and the total crypto market capitalization is $3.5 trillion, the Bitcoin Dominance Chart would show a value of 57.14% ($2 trillion ÷ $3.5 trillion x 100).
Notably, at the time of writing this article, BTC dominance is 54.04%. This hinges on the global market cap at $3.36 trillion and Bitcoin’s market cap at $1.82 trillion.
Importance Of The Bitcoin Dominance Chart
1. Market Sentiment Indicator
The dominance chart can be used as a sentiment indicator, reflecting the market’s attitude towards Bitcoin in contrast to other cryptocurrencies. This aligns with the Bitcoin Fear and Greed Index to understand Bitcoin’s market sentiment, and perhaps when to trade.
It is widely believed that a rising dominance chart may indicate increasing investors’ confidence in Bitcoin, while a declining chart may suggest growing interest in alternative digital assets.
2. Risk Management Tools
Investors can use the dominance chart to manage risk and diversify their portfolios. You can monitor the chart to identify potential shifts in market sentiment and adjust your investments accordingly.
3. Market Trend Indicator
You can also use the Bitcoin Dominance Chart in the crypto market. This is because a sustained increase in Bitcoin’s dominance may indicate a bullish trend, while a prolonged decline may suggest a bearish market trend.
Factors That Influence The Bitcoin Dominance Chart
1. Volatility In Bitcoin Price
Constant changes in Bitcoin’s price can significantly affect its dominance chart. A rapid increase in BTC price may increase its dominance, while a sharp decline can decrease it.
2. Altcoin Market Performance
The direction of the dominance chart can also be a function of altcoins’ performance. Bitcoin’s dominance may decline if altcoins record significant growth.
3. Global Economic Conditions
Economic conditions such as inflation, interest rates, and geopolitical tensions can impact the Bitcoin Dominance Chart as investors’ interest may dwindle, such that the value of Bitcoin drops and affects its dominance.
4. Regulatory Landscape
It is common knowledge that the regulatory framework for Bitcoin and other cryptocurrencies is not balanced across the world. Therefore, favorable regulations can increase investors’ confidence in Bitcoin, which, in turn, increases its dominance.
Frequently Asked Questions (FAQs) About The Bitcoin Dominance Chart
What Is The Significance Of The BTC Dominance Chart?
The dominance chart provides valuable insights into Bitcoin’s relative strength and influence in the crypto market.
How Can I Use The Dominance Chart For Investment Decisions?
Investors can monitor the Bitcoin Dominance Chart to identify potential shifts in market sentiment and adjust their investments.
What Is The Relationship Between The BTC Dominance Chart And Market Trends?
An increase in Bitcoin’s dominance may indicate a bullish trend and a decline in dominance may indicate a bearish trend.
Conclusion
The Bitcoin Dominance Chart is widely used to fully grasp the complexity and dynamism of the crypto market. While the chart is not a definitive predictor of future market movements, it can serve as a useful indicator for informed investment decisions. So, the chart will remain an essential metric for navigating the ever-changing crypto landscape as the market continues to evolve.
Last updated on February 8, 2025

